Tests and Results
Our study involved several bivariate and multivariate linear regressions.
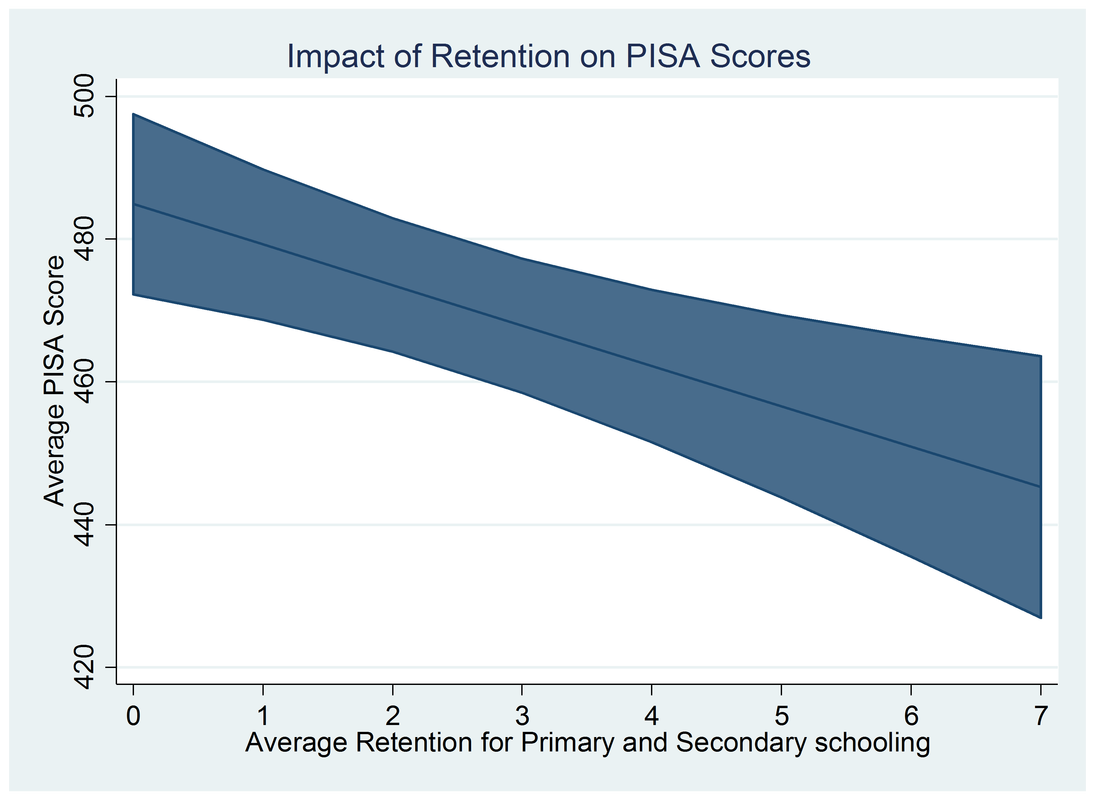
We began by running a bivariate linear regression where the dependent variable was average PISA score and the independent variable was average grade retention.
We began by running a bivariate linear regression where the dependent variable was average PISA score and the independent variable was average grade retention.

This test showed a negative relationship, with a coefficient of -5.67, a t-score of -3.21, and a p-value of 0.002 at the 95% confidence level. The standard error was 1.76. For the complete regression results refer to Image 1 in the Appendix.
These results suggested that repeating a grade either at the primary level or at the secondary level of education made students likely to score 5.7 less points in PISA, on average.
Next, we considered a few controls for our model. We thought that a country's wealth, level of development, and the proportion of the population living in urban areas could affect both retention rates and how successful students are in assessments such as PISA.
To control for wealth, we included a variable for GDP per capita. We created a dummy variable for participation in the Organization for Economic Cooperation and Development (OECD) to control for level of development. Finally, we included a control variable representing the share of urban population in each country.
Model: avg. PISA score = β0 + β1 avg. retention + β2 (logged) GDP p. Capita + β3 OECD
+ β4 Urban Population + εi
(N=121)
With the new controls, average retention completely lost its relevance on average PISA scores. The new p-score for average retention was 0.134 and the confidence interval ranged from a negative number to a positive number (passing by zero), meaning the impact may be zero.
GDP per Capita and OECD capture the endogeneity from the previous model. Due to skewness, we had to log GDP per Capita. The coefficient of the logged variable was 26.8, with a standard error of 4.14, a t-score of 6.5, and a p-value of 0.000. Hence, in general, the wealthier the country, the higher their average PISA score.
Being a member of the OECD also makes a big difference. For this variable the coefficient was 20.21, the t-score was 2.33, and the p-value was 0.022, with a standard error of 8.66.
The share of the population living in urban areas showed no impact on PISA scores. This is probably because wealthier and more developed countries tend to have a higher share of its population living in urban areas and this was already being captured by the variables GDP per capita and OECD. The complete regression results can be found in Image 2 in the Appendix.
Despite the results from the previous multivariate regression, we were not completely convinced that grade retention has no impact on academic performance and therefore on PISA scores; so we decided to test for grade repetition at the primary level, and at the secondary level separately to see if one is more relevant than the other.
Sure enough, a bivariate linear regression of average PISA scores and grade retention at the secondary level showed that repeating a grade at this level of education has no effect on average PISA scores. The coefficient for retention at the secondary level was weak, at -2.3. Moreover, the p-value was 0.086 and the confidence interval included zero. The complete regression results can be found in the Appendix, Image 3.
However, a bivariate linear regression using retention at the primary level as the independent variable suggested that repeating a grade at this level can negatively affect average PISA scores. The coefficient was -10.8 at the 95% confidence level, with a standard error of 1.83. See Image 4 in the Appendix.
The relationship continued to be strong when we controlled for GDP per capita, OECD membership, and the urban population as a share of the total population. We also controlled for the proportion of the female and male adult population with a college degree. This is an important control variable because the literature supports that the level of education of parents (especially mothers) is the most important predictor of a young student's academic success.
Model: avg. PISA score = β0 + β1 retention at primary level + β2 (logged) GDP p. Capita + β3 OECD + β4 Urban Population + β5 Women with college degree + β6 Men with college degree + εi
(N=121)
Even with the new control variables, the impact of grade repetition at the primary level continued to be statistically significant but much less than GDP per capita and membership in the OECD. The urban population as a share of the total population and the proportion of men and women with a college degree were not significant.
In this new model, the coefficient for retention at the primary level fell to -3.7, with a standard error of 1.8, while being member of the OECD has a coefficient of 18.36 and a standard error of 8.17. The logged GDP per capita presented a coefficient of 22.68, and a standard error of 4.33. To see the complete regression table, see Image 5 in the Appendix.
This shows that a country's wealth and level of development are more important factors for achieving a good PISA score, but having many students repeating a grade at the primary level has some negative impact.
Next, we wanted to see if there is any variation in the way grade repetition impacts different subject areas. With that objective, we ran several multivariate linear regressions using PISA scores in math, literacy, and science, separately as dependent variables and grade retention at the primary level as the key independent variable. We also included the same controls we had used for the previous test. We found that grade retention has a statistically significant negative impact on math and science but has no effect on reading.
Mathematics:
Model: Math PISA score = β0 + β1 retention at primary level + β2 (logged) GDP p. Capita + β3 OECD + β4 Urban Population + β5 Women with college degree + β6 Men with college degree + εi
(N=121)
Repeating a grade at the primary level of education has a negative impact on students' performance in mathematics. The coefficient for retention at the primary level is statistically significant at -4.21, with a standard error of 1.99. GDP per capita and OECD membership continued to present high significance, with coefficients of 26.02 (logged) and 13.97; and standard errors of 4.74 and 8.94, respectively (Appendix, Image 6).
Science:
Model: Science PISA score = β0 + β1 retention at primary level + β2 (logged) GDP p. Capita + β3 OECD + β4 Urban Population + β5 Women with college degree + β6 Men with college degree + εi
(N=121)
Science:
Model: Science PISA score = β0 + β1 retention at primary level + β2 (logged) GDP p. Capita + β3 OECD + β4 Urban Population + β5 Women with college degree + β6 Men with college degree + εi
(N=121)
Once again, repeating a grade during the first few years of education can negatively affect students' performance in science. The results are very similar to those in math. This time, the coefficient for grade retention is -4.25, with a standard error of 1.82. The logged GDP per capita had a coefficient of 22.6, with a standard error of 4.33, and the OECD dummy variable presented a coefficient of 17.42, and a standard error of 8.16 (Appendix, Image 7).
Literacy:
Model: Literacy PISA score = β0 + β1 retention at primary level + β2 (logged) GDP p. Capita + β3 OECD + β4 Urban Population + β5 Women with college degree + β6 Men with college degree + εi
(N=121)
This time, grade retention at the primary level showed no significance. The coefficient was -2.6, already low and not very meaningful. But this variable loses its importance completely when we look at the p-value (0.142) and the confidence interval (it includes zero). Refer to Image 8 in the Appendix for the complete regression results.
What we can conclude from these area-specific tests is that repeating a grade at the primary level can have negative implications for students' performance in math and science, but it does not help nor hurts performance in reading.
In addition to these tests for the primary level of education, we ran another batch of bivariate regressions using those same dependent variables but with grade repetition at the secondary level as the independent variable. Grade retention at the secondary level of education continued to present no effect on performance in either of the three areas.
As we continued our research, we thought it would be interesting to see whether the impact of grade retention varies across regions in the world. Hence, we created dummy variables for Asia, Latin America, Europe, and Middle East and North Africa.
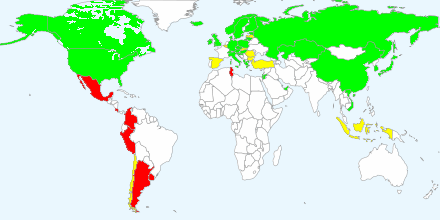
Retention at the Primary Level
as a Share of Total Enrollment, 2012
Green = 0% to 2%
Yellow= 2% to 4%
Red= 4% or greater
as a Share of Total Enrollment, 2012
Green = 0% to 2%
Yellow= 2% to 4%
Red= 4% or greater
Asia:
Model 1: Science PISA score = B0 + B1 retention at primary level + B2 (logged) GDP p. Capita + B3 OECD + B4 Urban Population + B5 Women with college degree + B6 Men with college degree + B7 Asia.
(N=121)
Model 2: Reading PISA score = B0 + B1 retention at primary level + B2 (logged) GDP p. Capita + B3 OECD + B4 Urban Population + B5 Women with college degree + B6 Men with college degree + B7 Asia.
(N=121)
Model 3: Math PISA score = B0 + B1 retention at primary level + B2 (logged) GDP p. Capita + B3 OECD + B4 Urban Population + B5 Women with college degree + B6 Men with college degree + B7 Asia.
(N=121)
The most impressive finding was that the coefficient for the "Asia" variable was at least 52 for each topic area (math, science, and reading). The "Asia" coefficient for reading was 56.1, with a standard error of 9.3; 52.2 for science, with a standard error of 9.9; and an impressive 65.6 for math, with a standard error of 10.4.
As for grade retention, Asian kids who repeat a grade at the primary level of education have lower PISA scores in science, but no impact was found in math or reading. When the dependent variable is science PISA scores, the coefficient for grade retention is -3.4, with a standard error of 1.6.
Middle East and North Africa:
Model 1: Science PISA score = B0 + B1 retention at primary level + B2 (logged) GDP p. Capita + B3 OECD + B4 Urban Population + B5 Women with college degree + B6 Men with college degree + B7 Middle East and North Africa.
(N=121)
Model 2: Reading PISA score = B0 + B1 retention at primary level + B2 (logged) GDP p. Capita + B3 OECD + B4 Urban Population + B5 Women with college degree + B6 Men with college degree + B7 Middle East and North Africa.
(N=121)
Model 3: Math PISA score = B0 + B1 retention at primary level + B2 (logged) GDP p. Capita + B3 OECD + B4 Urban Population + B5 Women with college degree + B6 Men with college degree + B7 Middle East and North Africa.
(N=121)
The coefficient for this variable is just as startling as what we found for Asia, but this time being from the Middle East or North Africa brought has an negative impact on students' scores. For math, the "Middle East and North Africa" variable had a coefficient of -49.68, with a standard error of 11.20. The same variable had a coefficient of -44.19 for science, with a standard error of 10.26; and a coefficient of -37.20 for reading, with a standard error of 10.15.
Once again, we found that repeating a grade at the primary level of education had a negative impact on science PISA scores but not on math or reading. The coefficient of the "retention at the primary level" independent variable was -3.74 on science, with a standard error of 1.70.
Latin America:
Model 1: Science PISA score = B0 + B1 retention at primary level + B2 (logged) GDP p. Capita + B3 OECD + B4 Urban Population + B5 Women with college degree + B6 Men with college degree + B7 Latin America.
(N=121)
Model 2: Reading PISA score = B0 + B1 retention at primary level + B2 (logged) GDP p. Capita + B3 OECD + B4 Urban Population + B5 Women with college degree + B6 Men with college degree + B7 Latin America.
(N=121)
Model 3: Math PISA score = B0 + B1 retention at primary level + B2 (logged) GDP p. Capita + B3 OECD + B4 Urban Population + B5 Women with college degree + B6 Men with college degree + B7 Latin America.
(N=121)
Like in Africa and the Middle East, being in Latin America puts kids in a great disadvantage when it comes to PISA scores, especially in mathematics. The coefficient for the "Latin America" independent variable was -45.96 in math, with a standard error of 13.18; -36.43 in science, with a standard error of 12.18; and a coefficient of -28.46 in reading, with a standard error of 11.98.
No relationship was found between grade retention at the primary level and PISA scores either in math, science, or literacy when we used the control for Latin America.
Europe:
Model 1: Science PISA score = B0 + B1 retention at primary level + B2 (logged) GDP p. Capita + B3 OECD + B4 Urban Population + B5 Women with college degree + B6 Men with college degree + B7 Europe.
(N=121)
Model 2: Reading PISA score = B0 + B1 retention at primary level + B2 (logged) GDP p. Capita + B3 OECD + B4 Urban Population + B5 Women with college degree + B6 Men with college degree + B7 Europe.
(N=121)
Model 3: Math PISA score = B0 + B1 retention at primary level + B2 (logged) GDP p. Capita + B3 OECD + B4 Urban Population + B5 Women with college degree + B6 Men with college degree + B7 Europe.
(N=121)
European students are at a great advantage in PISA scores in all three areas. The coefficient for the "Europe" variable was 24.61 in literacy, with a standard error of 7.59; 36.70 in math, with a standard error of 8.28; and 36.83 in science, with a standard error of 7.42.
By comparing the standard errors of all the region-specific tests, we can also see that Europe has the least variation in scores across countries, as compared to Asia, Latin America, and the Middle East and North Africa.
